GTmetrix Says F, PageSpeed Says 60 — Which Score Actually Matters?
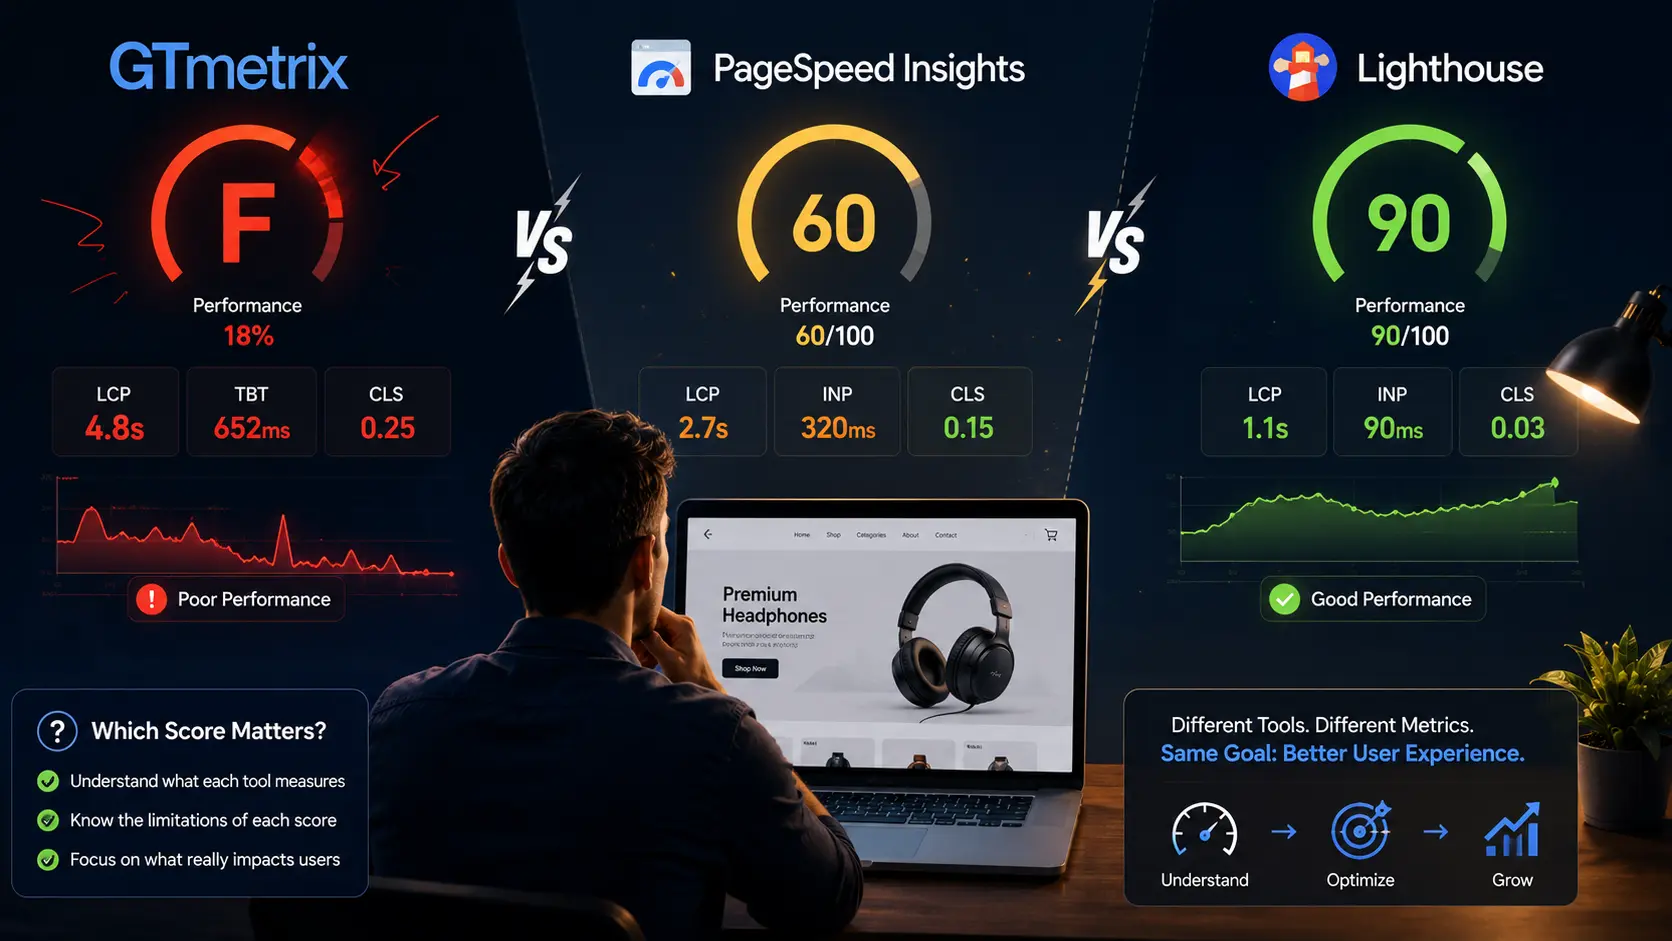
TL;DR: GTmetrix, PageSpeed Insights, and Lighthouse aren't three competing opinions — PageSpeed Insights and GTmetrix are both mostly built on Google's own Lighthouse engine, just configured differently (different test locations, device settings, and grading scales). Different numbers don't mean conflicting advice. Focus on Core Web Vitals, since those are what Google actually uses for ranking, not any tool's overall letter grade.
If you've ever run your site through two different speed checkers and gotten a "B" from one and a "62/100" from the other, you're not imagining things — and your site isn't secretly performing three different ways. The tools are just measuring under different conditions and presenting the results differently.
What Each Tool Actually Is
| Tool | What It Is |
|---|---|
| Lighthouse | Google's open-source auditing engine. This is the actual technology doing the measuring — it's built into Chrome DevTools and runs under the hood of other tools too. |
| PageSpeed Insights (PSI) | Google's own public tool. Runs Lighthouse, plus adds real-world Chrome UX Report (CrUX) data from actual visitors when available. |
| GTmetrix | A third-party tool that also runs Lighthouse under the hood, but lets you choose test server locations and device profiles, and presents results with its own letter-grade system. |
Why the Scores Don't Match
- Server location — GTmetrix lets you pick a test location; a test run from a server far from your hosting will show slower load times than one nearby
- Device and network emulation — simulated mobile connections vs. desktop connections produce very different results on the same page
- Grading scale — a letter grade (A–F) and a 0–100 score aren't calculated the same way, even from similar underlying data
- When the test ran — server response times and third-party script behavior can vary slightly between one run and the next
None of this means the tools are wrong. It means "what's my speed score" isn't a single fixed number — it depends on how and where you ask.
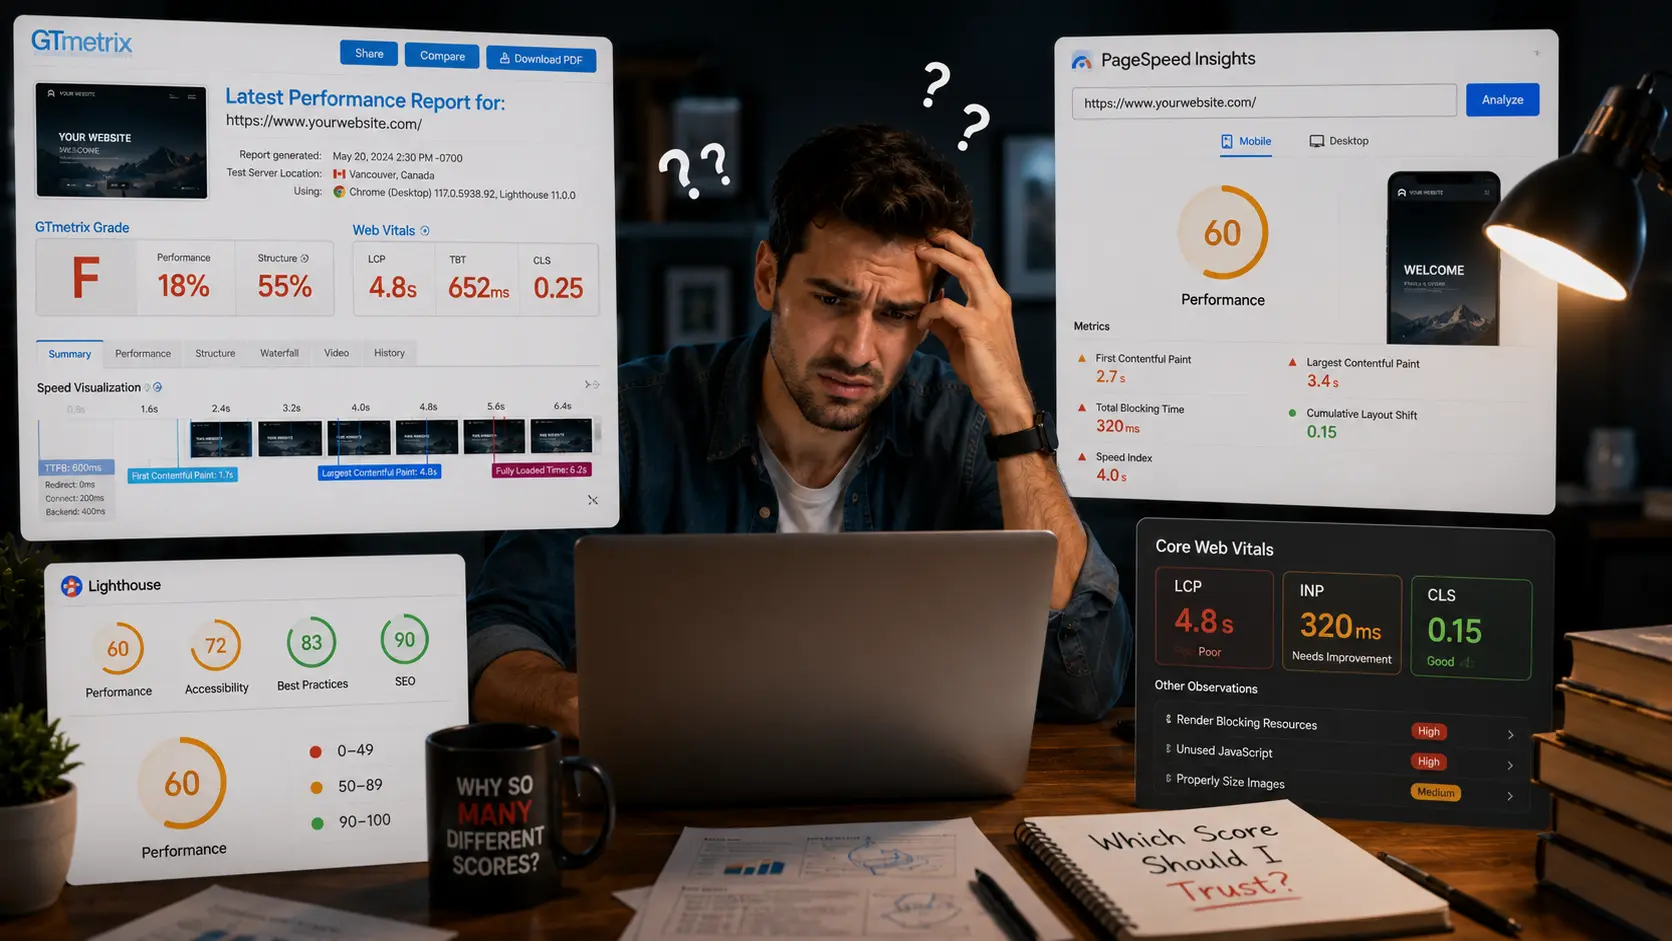
So Which Score Should You Actually Trust?
For most store owners, the answer is: don't chase a specific tool's overall grade. Focus on Core Web Vitals instead — these are the specific metrics Google has confirmed it uses as a ranking signal:
| Metric | What It Measures | Good Target |
|---|---|---|
| LCP (Largest Contentful Paint) | How fast the main content loads | Under 2.5s |
| CLS (Cumulative Layout Shift) | How much the page jumps around while loading | Under 0.1 |
| INP (Interaction to Next Paint) | How responsive the page feels when clicked/tapped | Under 200ms |
These are consistent across tools because they're Google's own defined metrics, not a tool-specific letter grade. Whichever checker you use, look for these numbers specifically instead of just the overall score.
Check My Core Web Vitals for Free →Real Data vs. Simulated Data — The Other Source of Confusion
On top of tool differences, there's also lab data vs. field data:
| Type | What It Measures |
|---|---|
| Lab Data | A single simulated load run right when you test — precise and repeatable |
| Field Data | Real visitors over the past 28 days (Chrome UX Report) — what people actually experienced |
A site can score well in a lab test but still perform poorly for real visitors on slower connections or older devices — which is why field data, when available, tends to be the more honest number.
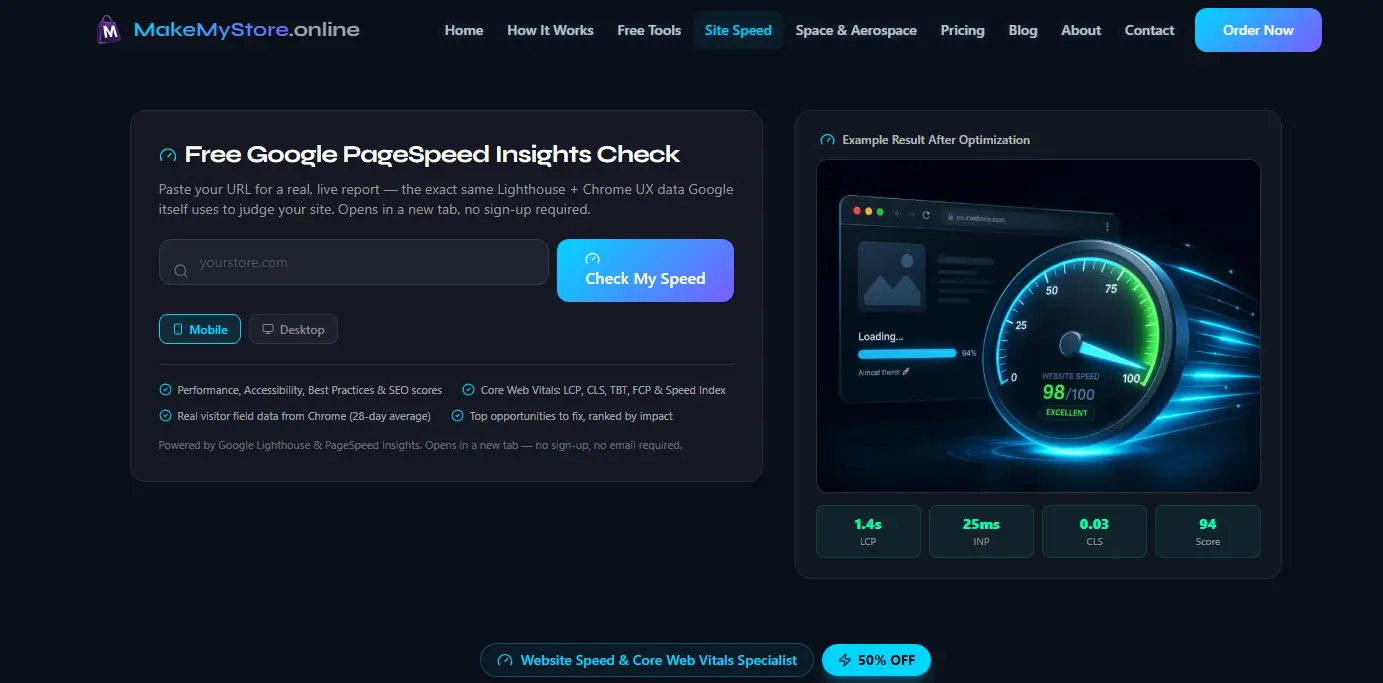
Our Free Tool Gives You Both, in One Place
Instead of juggling multiple checkers and trying to reconcile different scores, our free Website Speed Test runs a real Lighthouse + PageSpeed Insights scan and shows you everything together:
- Performance, Accessibility, Best Practices, and SEO scores
- Core Web Vitals — LCP, CLS, TBT, FCP, Speed Index, and server response time
- Real-visitor field data, when available — alongside the lab data, clearly labeled
- Top opportunities to fix, ranked by impact
No sign-up, no email, about 2 minutes.
Run My Free Speed Test →Once You Know What's Actually Wrong
Understanding the score is step one. Fixing it on a live store — without breaking your theme, apps, or checkout — is a separate job. Our process is the same every time:
- Confirm a rollback plan before touching anything
- Make changes one at a time
- Test each fix before moving to the next
Optimization Packages
| Package | Price | Fiverr Price (50% off) |
|---|---|---|
| Basic | $149.50 | |
| Standard | $349.50 | |
| Premium | $649.50 |
Works on any platform — WordPress, Shopify, Wix, Next.js, or a fully custom build.
Stop chasing a perfect score on every tool. Focus on Core Web Vitals, get one clear report, and fix what actually matters for rankings and conversions.